Weather
Drought in Belgium
The graphs and maps below provide a day-to-day monitoring of the possible drought status in the country based on 2 indices
- the Standardized Precipitation Index (SPI) which characterizes the total precipitation of the last 90 days.
- the Standardized Precipitation-Evapotranspiration Index (SPEI), which characterizes the water balance of the last 90 days, i.e. the difference between cumulative rainfall and evapotranspiration. Evapotranspiration is the amount of water evaporated or transpired by the soil and vegetation. Since it is difficult to measure, evapotranspiration is estimated from observations of temperature, global solar radiation, relative humidity and wind speed.
These 2 indices are established for periods of 90 days (3 months): SPI-3 and SPEI-3. They provide a complementary analysis of drought situations, as these are primarily the result of a precipitation deficit, but high evapotranspiration is an aggravating factor.
|
|
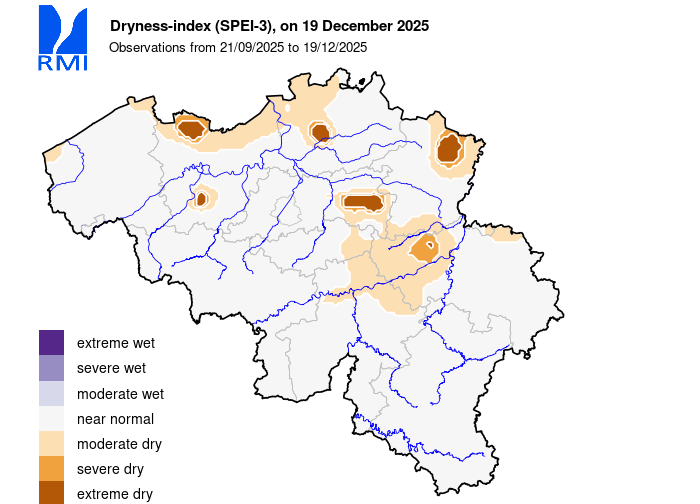
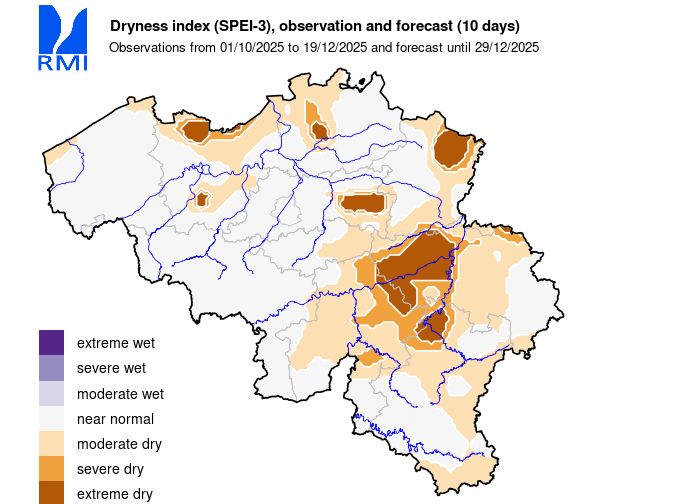
Explanation of the figures
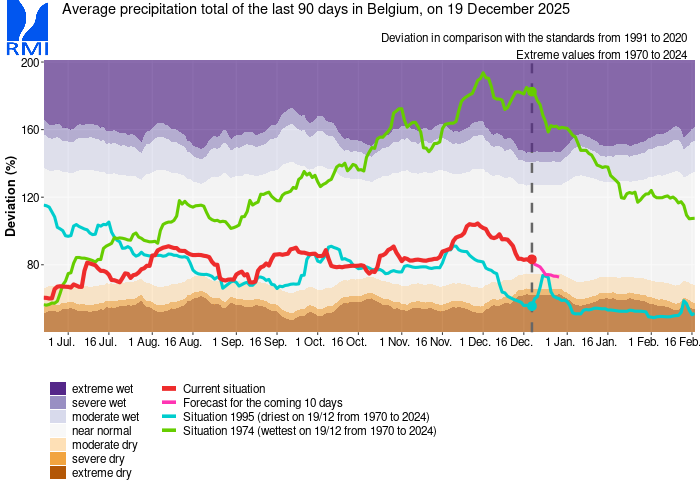
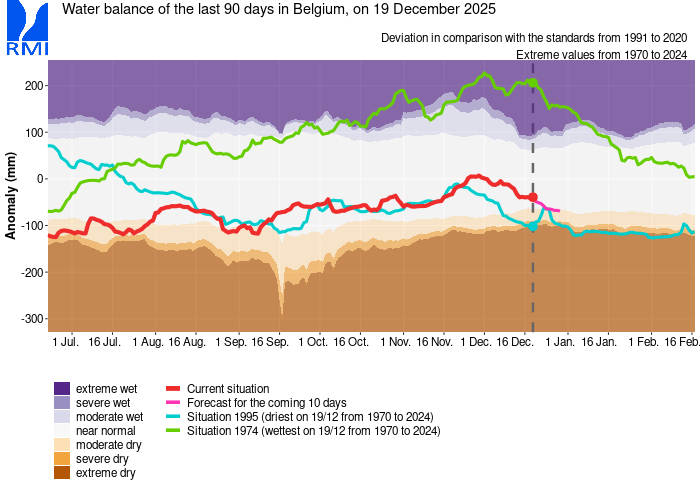
The graph above shows the evolution of the possible drought or rainfall surplus over time. The red line shows the position of the total precipitation (SPI-3) or the water balance (SPEI-3) of the last 90 days in relation to the climatological normal values (ratio to normal for SPI-3 and difference to normal for SPEI-3). This is an average for the entire Belgian territory. The green and blue lines indicate the evolution of the wettest 90-day period on the same date and the evolution of the driest 90-day period on the same date, respectively.
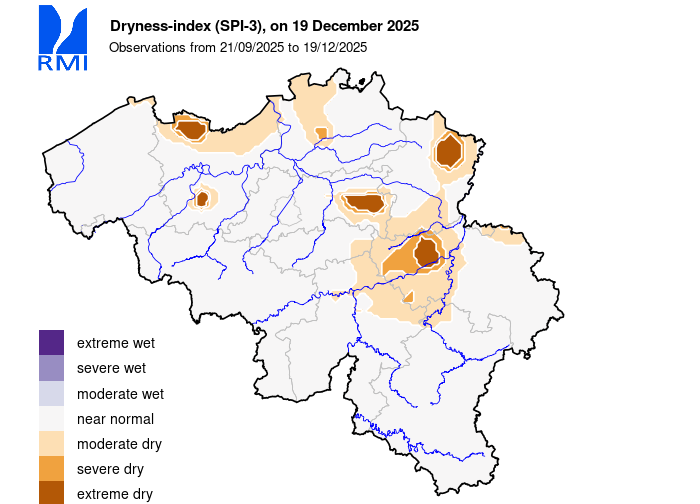
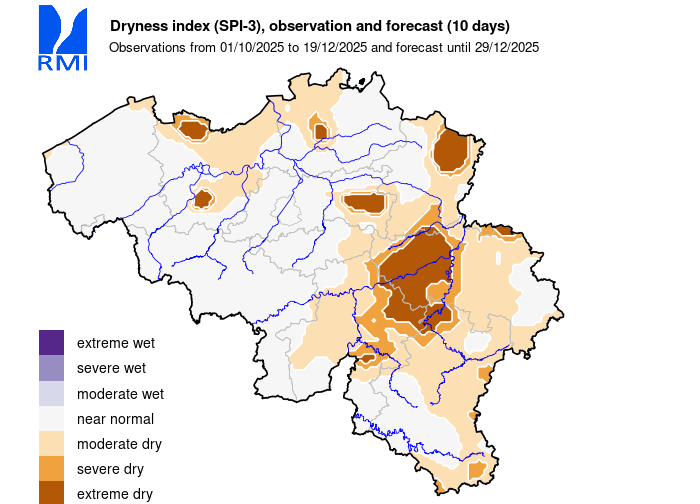
The maps above show how the SPI-3 and SPEI-3 drought indices behave spatially. The definition classes used (wet/dry, very dry/very wet, extremely dry/extremely wet) are set against a climatological reference period of 1991 to 2020 and each refer to return periods of 10-30 years, 30-50 years and more than 50 years respectively. For the SPI-3 forecasts, we use the rainfall totals of the last 80 days and the rainfall totals forecast for the next 10 days. The forecasts come from the European Centre for Medium-Range Weather Forecasts (ECMWF) model.
